October 3, 2026. Elon Musk said this week that AI will make jobs change "as they always have" and pay everyone a universal high income. The AI 2027 scenario scripted "AI takes some jobs" for exactly this quarter. Two research groups that track US payroll and survey data say something quieter and more specific. As of their latest updates in August and September 2026, there is no evidence of widespread job loss from AI; there is a large and widening gap for one group, workers aged 22 to 25 in the occupations most exposed to it; and the gap runs through hiring, not firing. This article sets out what the data show, what they cannot show, which tasks AI is actually being used for at work, and what a worker or a business owner should do with that information.
Key numbers
| Item | Number |
|---|---|
| Economy-wide AI job displacement in US payroll data (Stanford Digital Economy Lab, ADP data through June 2026) | No evidence |
| Employment gap, workers aged 22 to 25 in AI-exposed jobs (versus less-exposed peers; 13 percent when first measured in August 2025) | 19 percent below |
| Comparable gap for experienced workers (same study) | None |
| Main channel of adjustment (not increased separations or base pay cuts) | Reduced hiring |
| AI-related footprint in national labour statistics (Budget Lab at Yale, updated September 15, 2026) | None clearly yet |
| Global employment exposed to AI, IMF (60 percent in advanced economies, 26 percent in low-income countries) | Almost 40 percent |
| Claude conversations that look like work (Anthropic Economic Index, May 2026 period) | 43 percent |
| Augmentation versus automation in Claude usage (person stays involved versus hands the task over) | 51 to 49 |
| Estimated time for tasks done with Claude (classifier estimates, bucketed by order of magnitude) | About 5 hours to about 40 minutes |
| Meta AI code changes versus shipped features (per Reuters, August 2026) | Up 220 percent versus up 36 percent |
Stanford Digital Economy Lab (revised 12 August 2026), the Budget Lab at Yale (updated 15 September 2026), the IMF blog (14 January 2024), the Anthropic Economic Index (May 2026 period), Reuters via our August 2026 analysis, read 1 to 3 October 2026.
The short answer
If you are experienced and your work is the kind AI complements, the data show no effect on your employment so far. If you are early in your career and your work is the kind AI substitutes for, the data show employers hiring fewer people like you, and the effect has grown every quarter since it was first measured. Nobody's data show mass unemployment, and the people who publish the numbers say so plainly.
What the payroll data show: Stanford, August 2026
The most detailed study uses administrative payroll records from ADP covering millions of US workers. Erik Brynjolfsson, Bharat Chandar and Ruyu Chen of the Stanford Digital Economy Lab first published Canaries in the Coal Mine in August 2025, when it found a 13 percent relative decline in employment for workers aged 22 to 25 in the most AI-exposed occupations. The revised version, dated August 12, 2026 and running through June 2026, reports six facts:
- No evidence of widespread, economy-wide job displacement.
- Employment of workers aged 22 to 25 in AI-exposed occupations is 19 percent below where it would be had it kept pace with less-exposed peers. Experienced workers show no comparable gap.
- The divergence has widened steadily since August 2025.
- It operates mainly through reduced hiring of young workers, not increased separations.
- Declines are concentrated where AI usage substitutes for human tasks. Where usage complements workers, employment is flat or rising, especially for experienced staff.
- Adjustment is happening through employment rather than base pay.
The authors tested the obvious alternatives. The gap persists when technology firms and computer occupations are excluded, when exposure to interest-rate rises and remote work is controlled for, and across different measures of AI exposure. It weakens when education is controlled for, some of the trends predate generative AI, and it is more pronounced in the ADP sample than in national surveys. They call the facts "early, descriptive indicators", not causal estimates.
What the survey data show: Yale, September 2026
The Budget Lab at Yale, whose first report in October 2025 was co-written with Brookings, runs a tracker built on national labour statistics rather than one payroll provider. Its September 15, 2026 update reaches three conclusions: the occupational mix is not yet changing in ways that clearly align with the introduction of AI; measures of AI usage show no connection to changes in employment or unemployment; and a synthetic differences-in-differences analysis of AI exposure "does not yet clearly indicate an AI-related labor market footprint". The two studies are consistent. A hiring slowdown for one age band in some occupations is real in payroll microdata and too small, so far, to move national aggregates.
What the exposure estimates say
Exposure is not displacement; it measures which jobs AI can touch, not which it will replace. The most-cited figure comes from the IMF. In January 2024 Kristalina Georgieva wrote that almost 40 percent of global employment is exposed to AI, about 60 percent in advanced economies, 40 percent in emerging markets and 26 percent in low-income countries. Of the exposed jobs in advanced economies, roughly half may benefit from AI integration and the other half may see AI "execute key tasks currently performed by humans", lowering labour demand (IMF blog). The Stanford data are the first large sample to show which half a given job sits in: the split between substitution and complement is what separates the occupations with a hiring gap from those without one.
What people actually use AI for at work
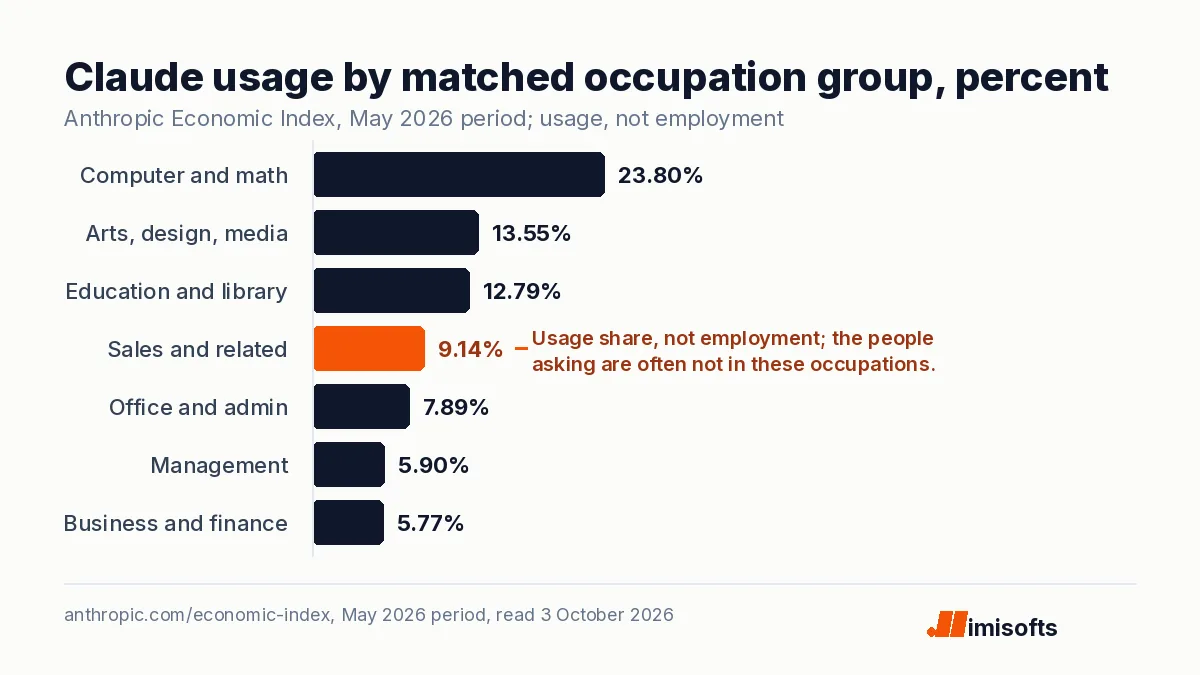
The Anthropic Economic Index matches the content of Claude conversations to the task lists of 923 occupations. Its latest release, covering May 2026, is a snapshot of usage, not a measure of jobs: the right reading is "AI is used for tasks commonly done by" an occupation, because the person asking is often not in that occupation. With that caveat, the picture is useful. About 43 percent of classified conversations look like work, 40 percent like personal life and 16 percent like coursework. Across all of them, 51 percent are augmentation, where the person stays actively involved, and 49 percent are automation, where the person hands the task over. The occupation groups whose tasks come up most are computer and mathematical (24 percent of usage), arts, design and media (14 percent), education (13 percent), sales (9 percent) and office and administrative support (8 percent). The single most common work tasks are searching databases and references for information, recommending products and services, answering software questions and writing or modifying programs. Tasks a classifier estimates would take a person about five hours alone ran to about 40 minutes of conversation. None of this says those occupations are shrinking; the Index's authors are explicit that it cannot support conclusions about displacement.
What the data cannot tell you
- Causation. Stanford's authors call their facts descriptive. Interest rates, post-pandemic over-hiring and the end of remote work all moved in the same years.
- Your own job. Every figure above is an average over an occupation. Within sales, a rep who closes complex deals and one who reads a script are exposed very differently.
- The future. The AI 2027 scenario put "AI takes some jobs" in late 2026 alongside a 30 percent stock market rise; our review of how AI 2027 is holding up finds the economy running behind its script. Musk's answer to the jobs question, a universal high income, has no funding source attached. Forecasts are not data.
- Productivity. More AI output is not more delivered work. Meta's own telemetry showed AI code changes up 220 percent while shipped features rose 36 percent, and the company shelved a plan to shrink teams by up to 60 percent; our analysis of the AI agent productivity gap has the detail.
If you are a worker: what the numbers suggest
- Check which side of the split your tasks sit on. If most of your week is searching, summarising, drafting and first-pass answering, you are in the substitution column. If it is judgement, relationships, physical work or accountability for outcomes, you are in the complement column, where employment is flat or rising.
- If you are under 26, treat hiring as the risk, not layoffs. The gap is in new positions. Apply where AI is used to complement experienced staff, and bring evidence that you can direct AI tools, which is the skill the complement column pays for.
- Move up the task list. The Index shows AI handling the first draft and the first search. The person who checks, decides and owns the result is still hired.
If you run a business: what the numbers suggest
The tasks at the top of the Index's list, searching for information, answering routine inquiries, recommending products and composing correspondence, are the tasks a small business pays people to do between the work that actually earns revenue. That is where automation pays first, and it is why the hiring gap shows up in junior roles rather than senior ones. A home services firm can put an AI calling agent for home services on inbound calls so that every lead is answered and booked, and keep its technicians and office lead doing the work the data say AI complements. A sales team can have an AI automation agency wire research, enrichment and follow-up into agents, so that the people it does hire spend their time on conversations. The measured lesson from 2026 is not that AI replaces a team. It is that AI changes what the next hire should be.
Frequently Asked Questions
The best current data say: not in aggregate, and not yet. US payroll research through June 2026 finds no evidence of widespread displacement, and national statistics show no AI-related change in employment or unemployment. The measured effect is a hiring gap for workers aged 22 to 25 in the occupations most exposed to AI.
Occupations where AI usage substitutes for human tasks, mainly information search, drafting, routine answering and entry-level technical work. Where AI usage complements workers, employment is flat or rising, especially for experienced staff, according to the Stanford Digital Economy Lab's August 2026 update.
The IMF estimates almost 40 percent of global employment is exposed to AI: about 60 percent in advanced economies, 40 percent in emerging markets and 26 percent in low-income countries. Exposure measures which jobs AI can touch, not which it will replace; roughly half of exposed jobs in advanced economies may benefit from it.
Not according to the data published so far. The Budget Lab at Yale's September 15, 2026 update finds no connection between AI usage measures and changes in employment or unemployment. The Stanford payroll study finds adjustment through reduced hiring of young workers rather than increased separations.
The Anthropic Economic Index for May 2026 finds about 43 percent of Claude conversations look like work, split roughly evenly between augmentation and automation. The most common work tasks are searching for information, recommending products and services, answering software questions and writing or modifying code. It measures usage, not jobs.
Automate the routine tasks the data say AI handles first, such as answering inbound calls, qualifying leads, research and follow-up, and keep hiring for judgement, relationships and accountability. The measured 2026 pattern is that AI changes what the next hire should be rather than eliminating teams.